Project · Compliance training and labour-law posters, e-commerce
From 9 AI Overview citations to 132, and what came back off
A US retailer selling employment-law training and state labour-law posters. Over seven months the tracked keyword set went from 16 terms in Google’s top three to 93, and from 9 terms cited inside an AI Overview to a peak of 132. Then about a third of that came back off before the window closed. Both halves are here, because the second half is the part that tells you what to do next.
The problem
Compliance is a category where the buyer’s first search is a question about the law, not a search for a product. An employer wants to know what a state requires this year. Only once they know does anyone think about buying the poster or booking the training.
That creates two problems at once. The product terms are few, expensive and already owned by incumbents with two decades of links behind them. And the question terms, the ones that come first, are exactly the queries Google has started answering itself. A page can hold position three on a compliance question and still be read by nobody, because the answer above it was assembled from three other sources.
Not “can this site rank for compliance training” but “when Google assembles the answer itself, is this site one of the sources it uses”. That is a different target, and it is measurable: position tracking records whether the tracked domain appears inside the AI Overview, not only beneath it.
What I found
A full crawl against the tracked keyword set, read alongside Search Console.
- Template-scale on-page defects. [Duplicate and missing H1s, duplicate and over-length titles, missing and duplicated meta descriptions — fill the counts from your own crawl.]
- Canonical handling. [Pages canonicalised to targets that were themselves non-indexable.]
- Internal linking. [Pages with no internal outlinks at all, and internal links carrying no anchor text.]
- Indexation directives. [What the noindex audit turned up.]
- The demand sat one step before the product. The training and poster pages were written to sell. The queries carrying the volume were asking what the rule is.
What I did
[Keep what is true, cut the rest, and put the counts in. This is the section a reader will weigh hardest.]
- [Set up position tracking across 614 commercial and informational terms so movement was measurable rather than anecdotal.]
- [The on-page pass: which templates, how many pages, and what changed at the top of each one.]
- [The question pages: how many were built, against which query clusters.]
- [Internal linking: how a question page hands the reader to the product.]
- [Structured data and crawler policy, if they were in scope.]
The result
Across the tracked set, between the fourth week of September 2025 and the first week of April 2026:
| Tracked set, 614 keywords | 24 Sep 2025 | 5 Mar 2026, peak | 7 Apr 2026 |
|---|---|---|---|
| Top 3 | 16 | 140 | 93 |
| Top 10 | 111 | 322 | 207 |
| Top 20 | 248 | 420 | 344 |
| Positions 51 to 100 | 55 | 31 | 5 |
| Ranking anywhere | 403 | 523 | 481 |
| Cited inside an AI Overview | 9 | 132 | 94 |
The line worth reading twice is the bottom of the table, not the top. Positions 51 to 100 emptied out, from 55 keywords to 5, while the number of keywords ranking anywhere barely moved. Nothing new arrived in bulk. What was already there moved up.
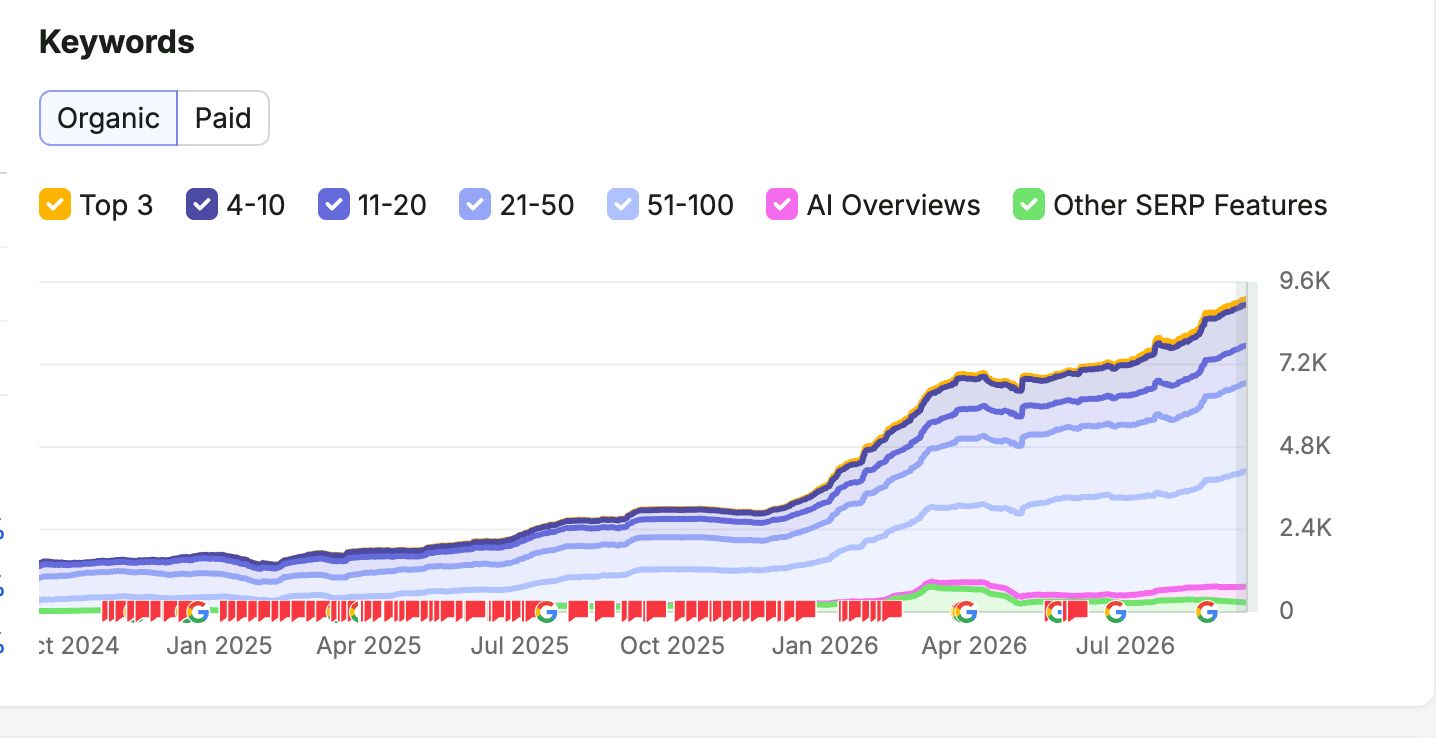
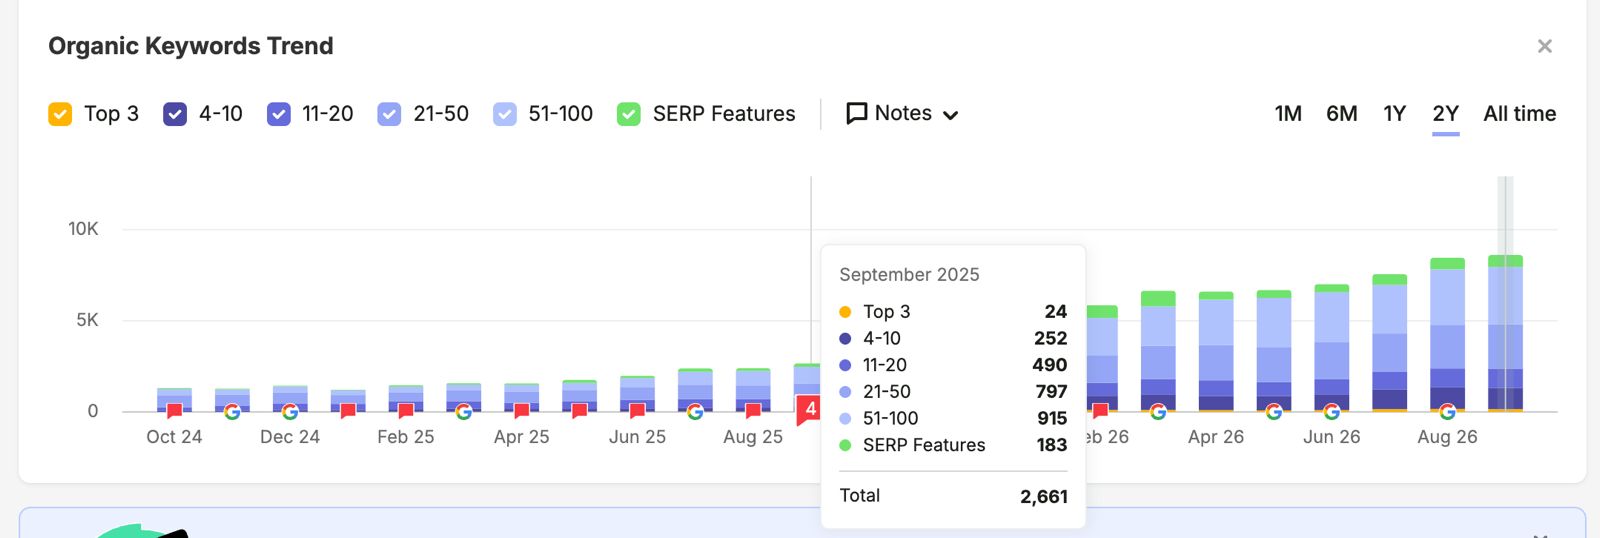
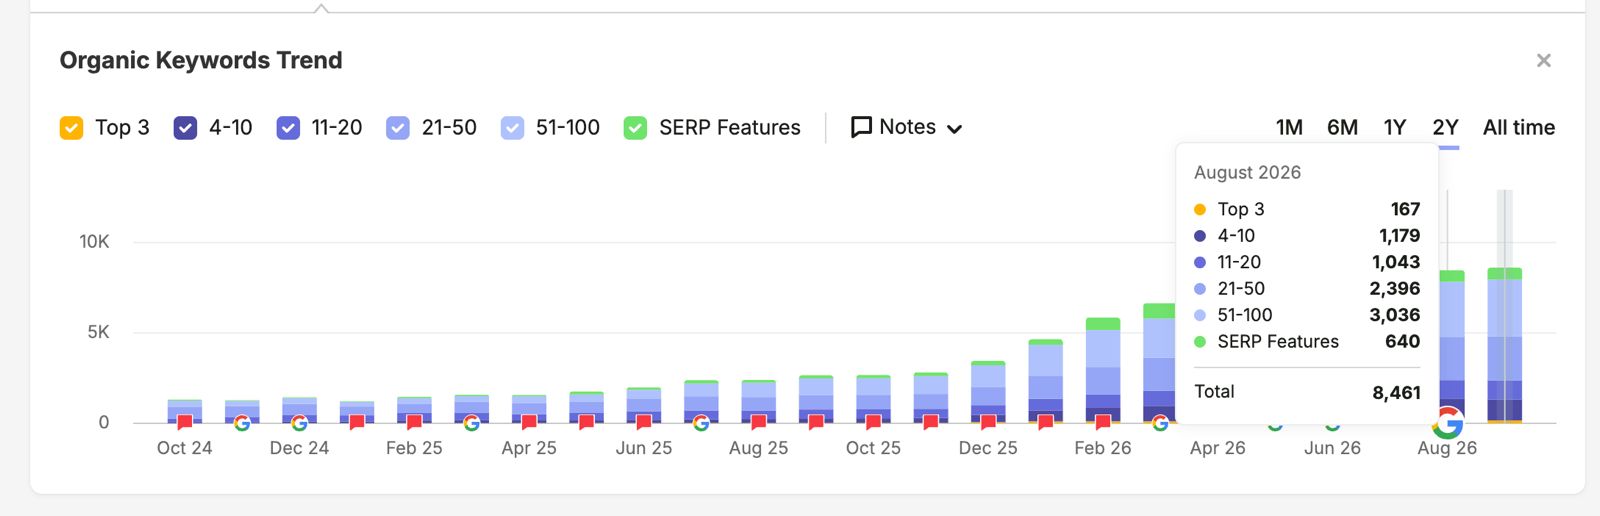
The same period, measured across the whole domain rather than the tracked set, shows the long tail doing the opposite — growing in every band at once.
| Whole domain, US | Sep 2025 | Aug 2026 | Change |
|---|---|---|---|
| Top 3 | 24 | 167 | +596% |
| Positions 4 to 10 | 252 | 1,179 | +368% |
| Positions 11 to 20 | 490 | 1,043 | +113% |
| Positions 21 to 50 | 797 | 2,396 | +201% |
| Positions 51 to 100 | 915 | 3,036 | +232% |
| SERP features | 183 | 640 | +250% |
| Total ranking keywords | 2,661 | 8,461 | +218% |
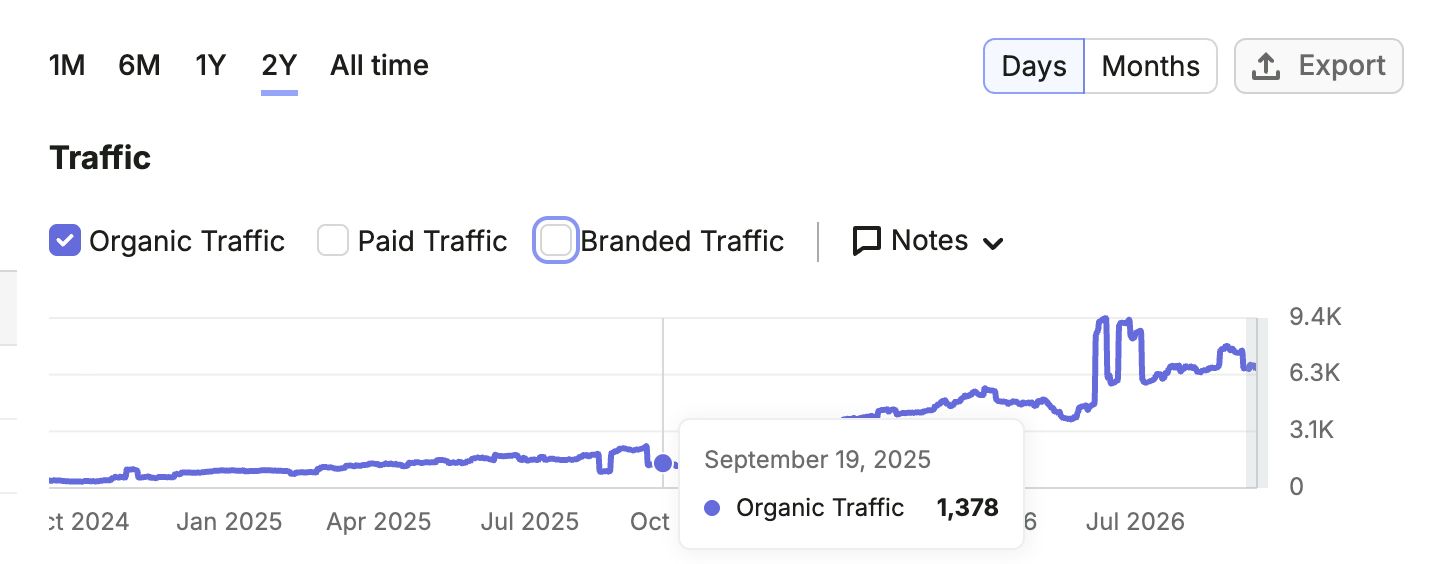
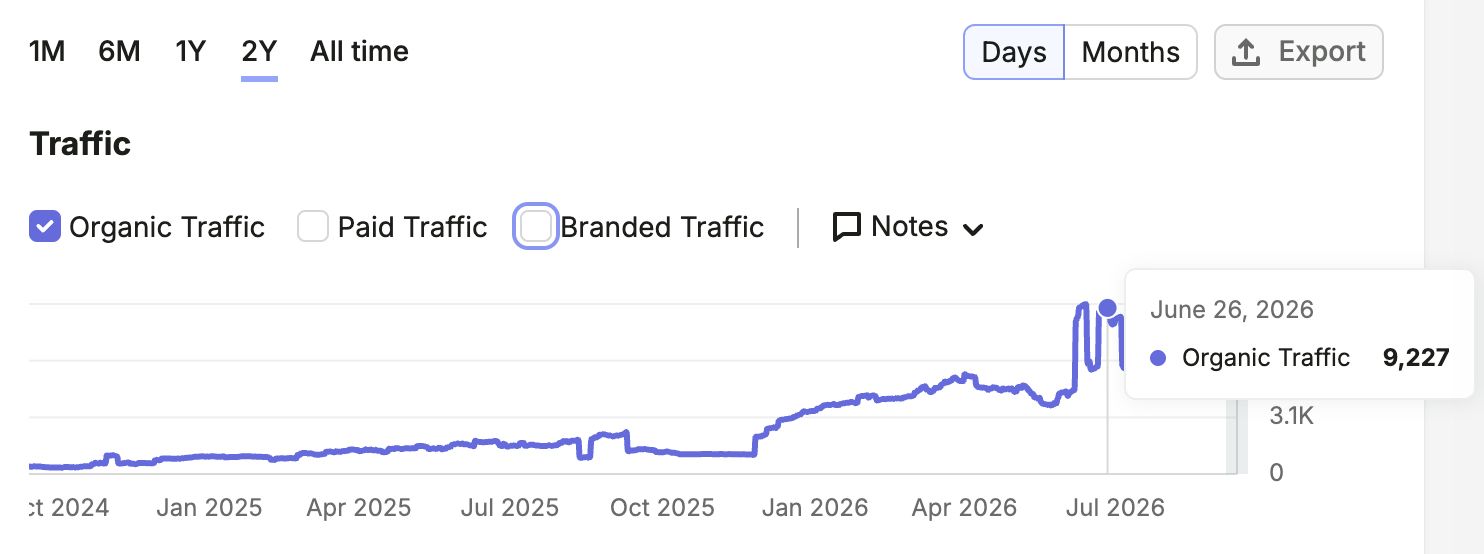
On estimated traffic, Semrush moved from 1,378 on 19 September 2025 to a band of roughly 6,300 to 7,000 through the late summer of 2026, with a single-day high of 9,227 on 26 June. The band is the honest figure. The 9,227 is one day on a spike, and anyone who opens the same chart on a different day will get a different number.
All of it is Semrush, which models estimates rather than measuring sessions. Two different scopes are in play: a 614-keyword tracked set that I chose, running September 2025 to April 2026, and the whole domain in the US database, running to August 2026. They are not interchangeable and the page keeps them apart. [If you can publish GA4 or Search Console figures for either window, they belong above these and these become the footnote.]
The part that came back off
The tracked set peaked on 5 March 2026 and gave a third of it back over the following five weeks. Top ten went from 322 to 207. Top three went from 140 to 93. AI Overview citations went from 132 to 94.
It matters that the shape of the loss is not the shape of a penalty. Keywords ranking anywhere held at 481, and positions 51 to 100 kept draining, down to 5. The set did not lose its footing. It lost its height: keywords slid from the top ten back into the twenties and thirties while the floor underneath them kept rising.
Two things are worth separating there. A ranking loss and a lost AI Overview citation look identical in a visibility score and behave nothing alike. A citation can come and go while the underlying position never moves, because the model reassembles the answer on every query. Roughly two-thirds of the drop in this set is the citation count, and treating that as a ranking problem would send you to fix the wrong thing.
[What you concluded, and whether the March 2026 update explains it. If you have tracking past 7 April, say whether it recovered — the whole-domain data kept climbing to August, so the two views of this site disagree over that window and the page should say which one you trust and why.]
Where it stands
On tracked visibility as of 7 April 2026, the competitive set read: laborlawcenter.com 26.9, this site 17.5, jjkeller.com 16.1, postercompliance.com 12.0, traliant.com 3.7. Second of five, having passed two established compliance publishers, and still roughly nine points behind a category incumbent whose advantage is links rather than pages.
What I would do differently
Let the tracker record a real baseline before the work starts. This campaign shows 10 keywords ranking on 3 September 2025, 110 on 17 September and 403 on 24 September. That is not a fortnight of extraordinary results; it is the keyword set being loaded in batches. Every number on this page therefore measures from the fourth week, which is the first honest reading, and it means I gave away three weeks of evidence I could have had for free. Set the campaign up, leave it alone for two weeks, then start.
Semrush Position Tracking and Organic Research, Screaming Frog, Google Search Console, Google Sheets.
The two charts above are drawn from the same exports these screenshots come from. They are here unedited so the numbers on this page can be checked against the tool rather than taken on trust. Click any one to open it full size.
Ranking, but not getting cited?
If Google is answering your category’s questions itself, position three is not the win it used to be. Twenty minutes on a call will tell you whether that is what is happening to you.
Typical reply time: within one working day